With emerging technologies such as electric vehicles and photovoltaics, developing a forecast is challenging due to the lack of history. For many, using a Bass Diffusion Model is the solution. While this model is widely used for forecasting new product sales, it is rarely seen in the electric industry due to the infrequency of new technologies.
The Bass Diffusion Model is shown below:
Where:
“q” is the Coefficient of Imitation. The Coefficient of Imitation is the likelihood that someone will start using the product because of internal influence such as “word-of-mouth.”
“P” is the Coefficient of Innovation. The Coefficient of Innovation is the likelihood that someone will start using the product because of external influences such as media coverage.
“m” is the Market Potential. The Market Potential is the theoretical total number who will use the product.
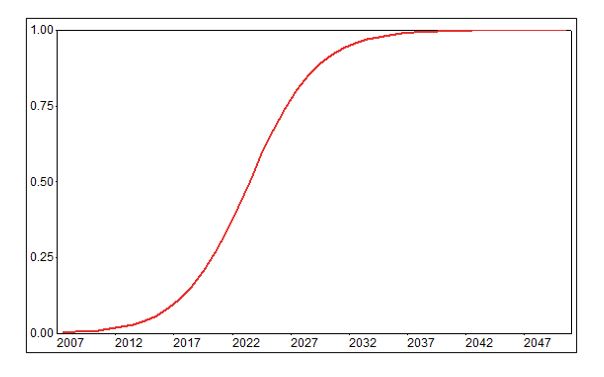
While the formula may be intimidating, the result is simple. The equation creates an S-shaped forecast with the parameterization controlling the speed of adoption and technology saturation.
While MetrixND doesn’t have a function called “Bass Diffusion,” that doesn’t mean that you can’t create it in a transformation variable. The picture above was created using the following parameters from a microwave oven adoption model (http://www.bus.iastate.edu/zjiang/research/vbm_ijrm.pdf).
p = 0.00071
q = 0.3444
m = 1
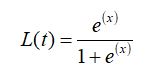
However, MetrixND provides a similar result in using the “Logit” function. This function creates an S-shaped curved through two data points using the syntax below.
In this function, the S-shaped curve goes through Value1 in Year1, Period1 and Value2 in Year2, Period2 where the numerical values for Value1 and Value2 are greater than 0.0 and less than 1.0. The logit function is defined by the equation below.
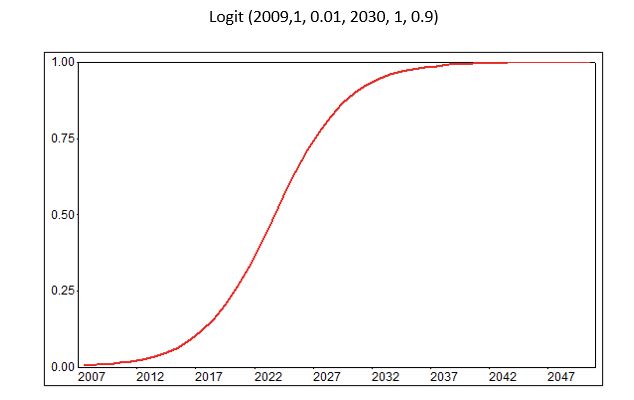
Once again, if the formula is too intimidating, just look at the results. Using the following parameterization, the result is almost identical to the Bass Diffusion Model shown above.
Using a Bass Diffusion Model or Logit function creates S-shaped curves that replicate real-world technology adoption patterns.
Either of these curves may be used in a regression model to calibrate the shape to historical adoption patterns. By exploring different curve parameterizations, a regression model can be created that fits the historic technology adoption and projects the future adoption along a classic adoption curve.
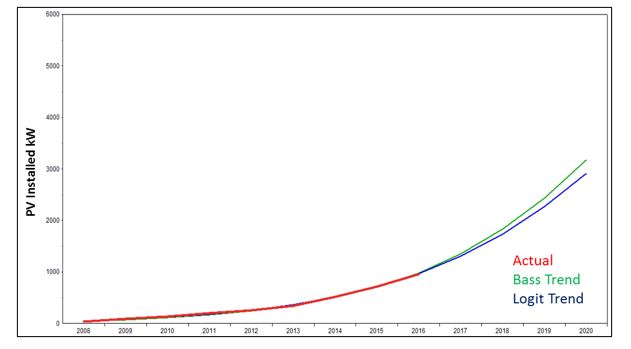
Below are the Bass and Logit curves applied to historic photovoltaic adoption from 2008 through 2016 for one service territory. Both trends fit the historic data and present an adoption patterns that accelerates in the future. The slight difference in the forecast results from the variation in the mathematical equations.
The next time you forecast a new technology such as electric vehicles or photovoltaics, consider using the Logit function.
Mark Quan is a Principal Forecast Consultant with Itron’s Forecasting Division. Since joining Itron in 1997, Quan has specialized in both short-term and long-term energy forecasting solutions as well as load research projects. Quan has developed and implemented several automated forecasting systems to predict next day system demand, load profiles, and retail consumption for companies throughout the United States and Canada. Short-term forecasting solutions include systems for the Midwest Independent System Operator (MISO) and the California Independent System Operator (CAISO). Long-term forecasting solutions include developing and supporting the long-term forecasts of sales and customers for clients such as Dairyland Power and Omaha Public Power District. These forecasts include end-use information and demand-side management impacts in an econometric framework. Finally, Quan has been involved in implementing Load Research systems such as at Snohomish PUD. Prior to joining Itron, Quan worked in the gas, electric, and corporate functions at Pacific Gas and Electric Company (PG&E), where he was involved in industry restructuring, electric planning, and natural gas planning. Quan received an M.S. in Operations Research from Stanford University and a B.S. in Applied Mathematics from the University of California at Los Angeles.