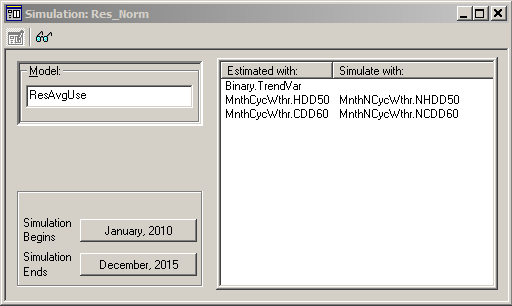
I’m using the Simulation Object in MetrixND to weather normalize historic sales. When configured, the object allows me to simulate the model replacing the X variables with a scenario. In weather normalization, the simulated X variables are the normal weather heating and cooling variables. My simulation is shown below.
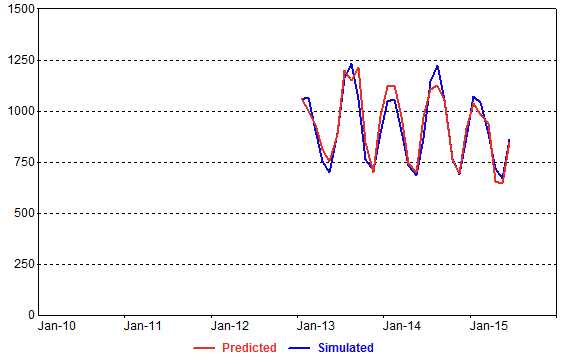
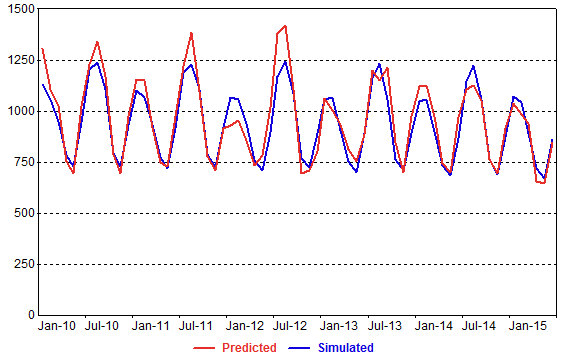
When I select the “eyeglasses” and view the results, I notice a peculiar situation. I’m missing results from 2010 through 2012. I can see the missing values in the “Actual vs. Predicted” graph as shown below.
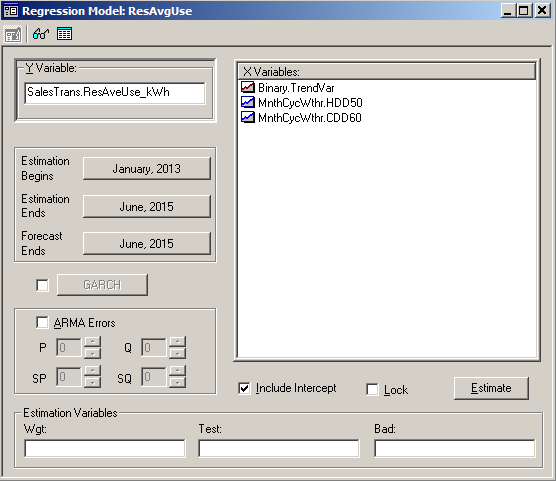
Why am I missing results from 2010 through 2012? Looking closely, I see my model is estimated from 2013 through 2015. The Simulation Object develops the simulated values using the Model Predicted values, so the Model cannot calculate a simulated value because it does not have Predicted values prior to 2013.
A simple, but incorrect, solution to the problem is to change the model estimation period to include 2010 through 2012 data. The problem with this solution is that the weather coefficients will change when these data are added. I chose to estimate the model from 2013 forward because I did not want 2010 through 2012 data to influence the weather normalization process.
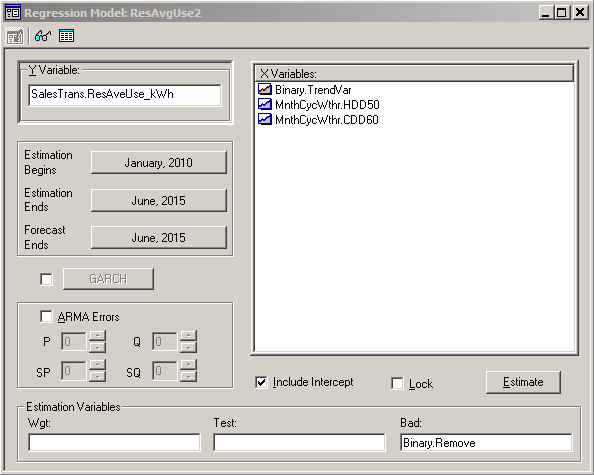
The correct solution is to change the model estimation period to include the 2010 through 2012 data AND mark these data as “bad.”
To mark the data as “bad,”I create a binary variable named “Remove” with the equation “Year <= 2013” as shown below.
This variable returns a value of “1” for all dates prior to 2013 and a value of “0” for all dates beginning in 2013. Then, I insert this variable, “Remove” into the bad box in the regression form as shown below.
By marking 2010 to 2012 as bad, the model coefficients are not influenced by these data. However, the model will still calculate a predicted value which is used in the Simulation Object. The simulation object calculates the results beginning in 2010 which are seen in the “Actual vs. Predicted” graph.
With the full simulation results, I finish normalizing my historic sales.
Mark Quan is a Principal Forecast Consultant with Itron’s Forecasting Division. Since joining Itron in 1997, Quan has specialized in both short-term and long-term energy forecasting solutions as well as load research projects. Quan has developed and implemented several automated forecasting systems to predict next day system demand, load profiles, and retail consumption for companies throughout the United States and Canada. Short-term forecasting solutions include systems for the Midwest Independent System Operator (MISO) and the California Independent System Operator (CAISO). Long-term forecasting solutions include developing and supporting the long-term forecasts of sales and customers for clients such as Dairyland Power and Omaha Public Power District. These forecasts include end-use information and demand-side management impacts in an econometric framework. Finally, Quan has been involved in implementing Load Research systems such as at Snohomish PUD. Prior to joining Itron, Quan worked in the gas, electric, and corporate functions at Pacific Gas and Electric Company (PG&E), where he was involved in industry restructuring, electric planning, and natural gas planning. Quan received an M.S. in Operations Research from Stanford University and a B.S. in Applied Mathematics from the University of California at Los Angeles.