Forecasting New Technologies - When Nothing Else Works
December 27, 2017
Share this story on:
In a recent project, we were asked to help settle a question. Which forecast is reasonable: One forecasting average annual system demand growth of 0.4 percent or one forecasting system peak demand growth at 1.3 percent? Just for some context, our recent utility survey showed that on average utilities expect 0.5 percent long-term system load growth. As it turned out, if you exclude data center loads you get something close to the low forecast and if you explicitly account for data center load growth you get something close to the 1.3 percent forecasted growth.
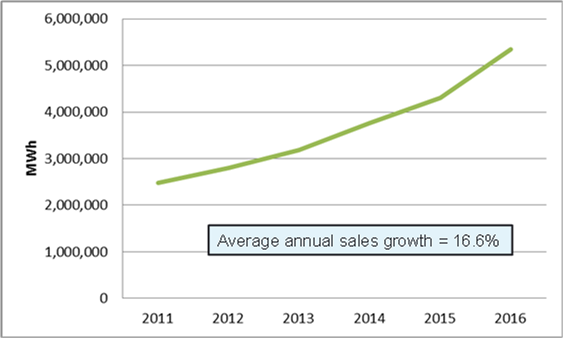
At a U.S. level, data center load growth has largely been mitigated by efficiency improvements. In this service area, data centers matter. Data centers are highly concentrated, and by far the largest data center concentration is in Northern Virginia (NOVA); data center load growth there has been insane. The first figure shows data center load growth.
Data center loads went from roughly 10 percent of commercial sales in 2011 to 25 percent of commercial sales in 2016. The question is how to forecast this kind of sales growth. Using regression modeling, we tried relating data center sales growth to economic growth, cloud-based spending, measure of cost of computing and modeling data center loads as part of total commercial sales with interacting trend variables. Nothing worked.
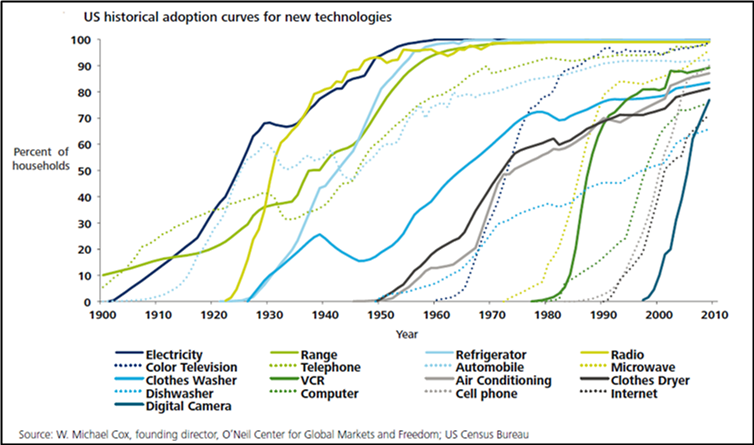
We then tried a second approach that entailed treating the data center phenomena as a new technology. Pretty much all new technologies tend to follow an S-shaped adoption path as illustrated.
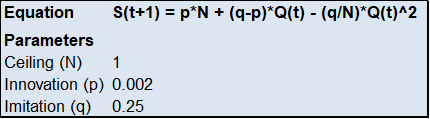
NOVA data center load growth is also following this path with load increasing at an accelerating rate. Like all new things, it can’t grow like this forever. One approach of explaining the adoption path is with a Bass Diffusion Model (Bass Model). The Bass Diffusion model generates an S-shaped curve using the equation shown here:
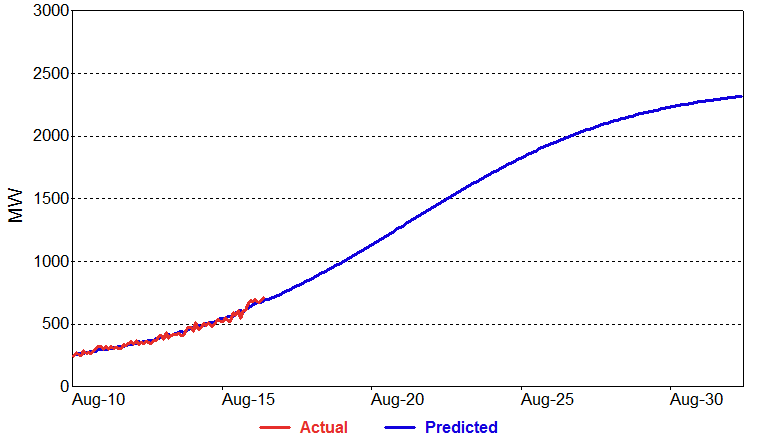
The coefficients p and q best explained the historical data center load growth path. The estimated curve was regressed on actual monthly data center capacity and generated the forecast shown next.
The model implies continued strong growth in data center loads out through 2022 where it begins to slow. The second part of the project was to validate the reasonableness of the forecast. We were able to do this through extensive market research on factors driving data center demand and discussions with one of the leading data center brokers in the region. Expected strong demand in cloud computing coupled with the unique regional infrastructure (NOVA has the highest density of fiber anywhere in the United States and three new cables with direct connections to Europe, Africa, and South America) supported the reasonableness of the data center demand forecast.
We foresee being able to use the same approach for forecasting electric vehicles, solar load adoption, and in the northeast, cold climate heat pump adoption.
Eric Fox is Director, Forecasting Solutions with Itron where he directs electric and gas analytics and forecasting projects, provides regulatory support, and manages Itron’s Boston office. Fox has over 30 years of forecasting experience with expertise in financial forecasting and analysis, long-term energy and demand forecasting, and load research. Eric has a strong foundation in forecast model development, technology assessment, and statistics. Eric started his forecasting career supporting and implementing the EPRI residential and commercial end-use forecast models. He helped developed the Statistically Adjusted End-Use (SAE) modeling framework that leverages off of the Energy Information Administration National Energy Modeling System and Annual Energy Outlook. Eric provides forecast training through utility workshops and webinars and has assisted numerous utilities and system operators with implementing SAE models for long-term energy and demand forecasting. Eric has a B.A. and M.A. in Economics from San Diego State University.