I think of MetrixLT as a fancy load shape manipulator and calculator. While the software was originally designed to calibrate load shapes to monthly energy forecasts, newer features of MetrixLT allow users to calculate normal weather (including Rank and Average methods), add and subtract load shapes, and perform top-down calibrations of hourly loads. Within the myriad of features, I’ve found a hidden gem that helps me forecast peak loads. MetrixLT builds my monthly peak database.
The foundation for the monthly peak model is historic monthly peaks and the weather associated with those peaks. Monthly peaks are obtained from historic hourly temperatures. Once the peaks are identified, the dates of the peaks must be used to obtain the associated weather. Instead of culling through complex Excel formulas, MetrixLT creates this database from daily peak data in a single transformation.
An example of the results is shown below. In this figure, the January 2005 peak is 900 MW. The temperature that produced the 900 MW peak is 16.42 degrees. Likewise, the temperature on the day before peak is 33.13 degrees.
While this figure shows the temperature and prior day temperatures associated with the monthly peak, MetrixLT can provide any daily condition associated with the peak, such as dew point, wind speed or demand response estimates.
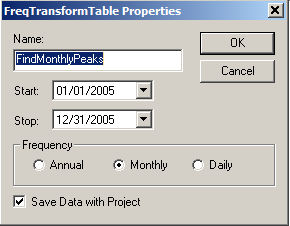
To create a monthly peak database, use the Frequency Transformation in MetrixLT. This transformation converts data of a different periodicity into monthly data. Begin by creating the Frequency Transformation and setting the frequency to “Monthly” as shown below.
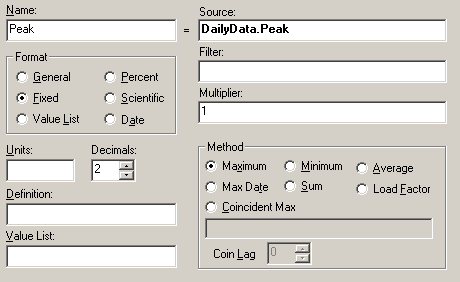
Within this Transformation, insert variables you want shown in the peak database. In this example, three variables are included.
1. Monthly Peak. The monthly peak value is obtained by creating the variable and placing the daily peak series in the “Source” box. Assign the method “Maximum” and Transform will return the monthly peak value.
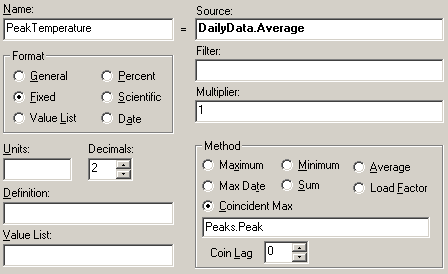
2.Temperature on the day of the Peak. The temperature on the peak day is obtained by creating another variable and placing the daily temperature series in the “Source” box. Assign the “Coincident Max” method and insert the daily peak series in the Coincident Max box as shown below. This transformation will return the daily temperature coincident with the monthly peak value.
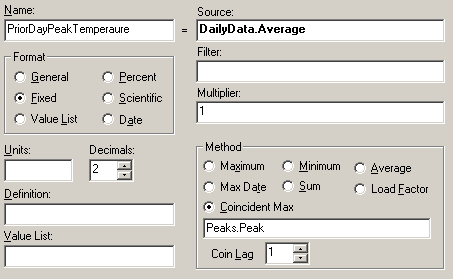
3. Temperature on the day before the Peak. The temperature on the day before the peak is obtained with another variable. In this variable, assign the daily temperature series as the “Source”, select the “Coincident Max” method, and assign the daily peak series in the “Coincident Max” box. For this variable, assign “Coin Lag” the value of “1”. This transformation returns the daily temperature coincident with the monthly peak value, lagged one day.
While the three variables in this example result in the database shown at the top, the example is easily extended to obtain temperatures two days before the peak or daily wind speed on the peak day by defining more variables. Once all the desired variables are included in the monthly peak database, simply export the data, import the values into MetrixND, and build the monthly peak model.
Mark Quan is a Principal Forecast Consultant with Itron’s Forecasting Division. Since joining Itron in 1997, Quan has specialized in both short-term and long-term energy forecasting solutions as well as load research projects. Quan has developed and implemented several automated forecasting systems to predict next day system demand, load profiles, and retail consumption for companies throughout the United States and Canada. Short-term forecasting solutions include systems for the Midwest Independent System Operator (MISO) and the California Independent System Operator (CAISO). Long-term forecasting solutions include developing and supporting the long-term forecasts of sales and customers for clients such as Dairyland Power and Omaha Public Power District. These forecasts include end-use information and demand-side management impacts in an econometric framework. Finally, Quan has been involved in implementing Load Research systems such as at Snohomish PUD. Prior to joining Itron, Quan worked in the gas, electric, and corporate functions at Pacific Gas and Electric Company (PG&E), where he was involved in industry restructuring, electric planning, and natural gas planning. Quan received an M.S. in Operations Research from Stanford University and a B.S. in Applied Mathematics from the University of California at Los Angeles.