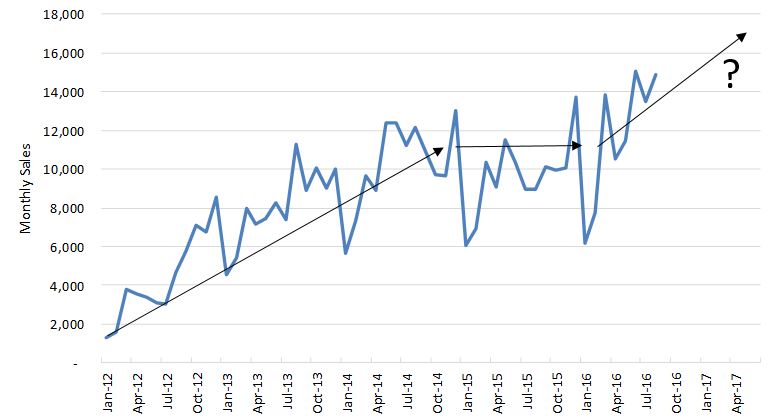
I love straight lines. After all, the fastest route between any two points is a straight line. But in forecasting, going from point A to point B isn’t always as straightforward as we imagine.
There are two ways to capture long-term growth in electric sales. The best way is to correlate growth with a macroeconomic driver. The process involves endless iterations of testing alterative series until you find one that works and makes sense. For those of us with less patience, a linear trend is used, which captures the average growth over the historic period and apply it to the forecast. While this is easier, we understand that past growth won’t always happen in the future (thus the need for a macroeconomic driver).
Another option is to create a growth variable which captures growth based on a percent increase in each year. But, how do you create this growth variable in MetrixND? In Excel, creating a growth rate variable is as simple as creating the following formulas assuming that X is the growth rate.
C4=C3*(1+x) C5=C4*(1+x).
For example, a one percent growth rate beginning with a base value of 1.0 will yield a value of 1.01 in the second period. In six periods, the value grows to 1.0510. These first six values are shown below.
Period
Index Value
1
1.0000
2
1.0100
3
1.0201
4
1.0303
5
1.0406
6
1.0510
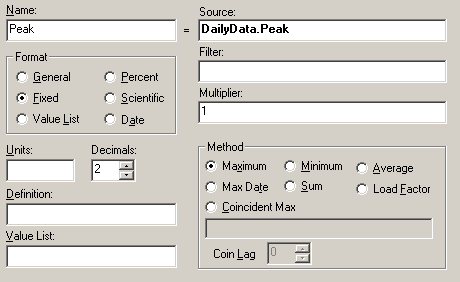
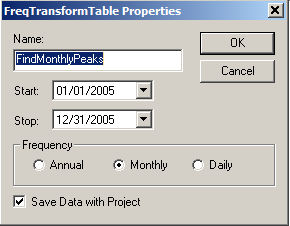
In MetrixND, the same index can be created using four transform variables in a transformation tables. First, create two variables that serve as the base index value and the growth rate. Second, create a period index. Finally, create the growth index using the first three variables as shown below.
The transformation table result as well as a graph of the Growth index is shown in the final two pictures.
Keep the growth rate index in your toolbox of modeling techniques. You never know which technique will work best when developing your models and long-term forecasts.
Mark Quan is a Principal Forecast Consultant with Itron’s Forecasting Division. Since joining Itron in 1997, Quan has specialized in both short-term and long-term energy forecasting solutions as well as load research projects. Quan has developed and implemented several automated forecasting systems to predict next day system demand, load profiles, and retail consumption for companies throughout the United States and Canada. Short-term forecasting solutions include systems for the Midwest Independent System Operator (MISO) and the California Independent System Operator (CAISO). Long-term forecasting solutions include developing and supporting the long-term forecasts of sales and customers for clients such as Dairyland Power and Omaha Public Power District. These forecasts include end-use information and demand-side management impacts in an econometric framework. Finally, Quan has been involved in implementing Load Research systems such as at Snohomish PUD. Prior to joining Itron, Quan worked in the gas, electric, and corporate functions at Pacific Gas and Electric Company (PG&E), where he was involved in industry restructuring, electric planning, and natural gas planning. Quan received an M.S. in Operations Research from Stanford University and a B.S. in Applied Mathematics from the University of California at Los Angeles.