Calculating an Average Annual Growth Rate in MetrixND
September 20, 2017
Share this story on:
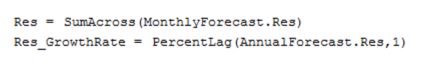
After finishing my forecast, I like to present forecast average annual growth rates. These results are calculated by converting the monthly forecast into annual values using a Transformation table with an annual periodicity. The formulas used in the annual Transformation table are shown below.
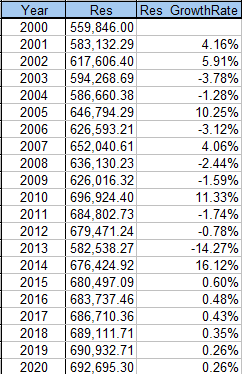
In these equations, the “Res” variable sums the monthly residential sales forecast into annual sales using the “SumAcross” function. The “Res_GrowthRate” variable calculates the year-to-year growth rates using the “PercentLag” function and the newly created “Res” variable. The results shown below are annual sales and growth rates.
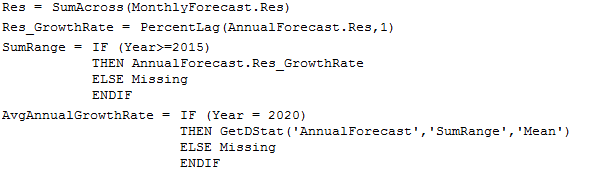
While year-to-year numbers are valuable, most forecasters like to communicate average annual growth rates. In this case, what is the average annual growth rate for the forecast? To calculate this, I added two new variables in the annual Transformation table, “SumRange” and “AvgAnnualGrowthRate” as shown below.
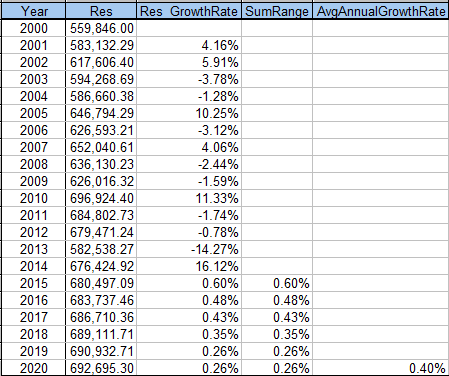
The “SumRange” variable isolates the forecast period, which, in this example, begins in 2015. The variable uses the “IF-THEN-ELSE-ENDIF” function to remove any values which are not defined in the IF condition. In this case, all the values prior to 2015 are removed as shown below.
The “AvgAnnualGrowthRate” variable takes the “SumRange” results and obtains the average to present the average annual growth in the forecast period. The key component of this variable is the “GetDStat” function. This function obtains the variable average (mean) from the DStat tab. The IF condition is used to place the annual average growth rate in the year 2020 row.
Typically, the average annual growth rates are calculated in a spreadsheet. Forecasters copy and paste results into a spreadsheet where annual averages are easily calculated. However, using the two variables described above allows for the dynamic calculation of results, removing the need to copy and paste into the spreadsheet.
Mark Quan is a Principal Forecast Consultant with Itron’s Forecasting Division. Since joining Itron in 1997, Quan has specialized in both short-term and long-term energy forecasting solutions as well as load research projects. Quan has developed and implemented several automated forecasting systems to predict next day system demand, load profiles, and retail consumption for companies throughout the United States and Canada. Short-term forecasting solutions include systems for the Midwest Independent System Operator (MISO) and the California Independent System Operator (CAISO). Long-term forecasting solutions include developing and supporting the long-term forecasts of sales and customers for clients such as Dairyland Power and Omaha Public Power District. These forecasts include end-use information and demand-side management impacts in an econometric framework. Finally, Quan has been involved in implementing Load Research systems such as at Snohomish PUD. Prior to joining Itron, Quan worked in the gas, electric, and corporate functions at Pacific Gas and Electric Company (PG&E), where he was involved in industry restructuring, electric planning, and natural gas planning. Quan received an M.S. in Operations Research from Stanford University and a B.S. in Applied Mathematics from the University of California at Los Angeles.