On Aug. 21, 2017, people gathered across the continent to witness the first total solar eclipse visible from the contiguous United States since Feb. 26, 1979. The consensus among those who watched the sun become momentarily blotted out by the moon seems to be that it was a worthwhile experience. In fact, one of our Itron colleagues in the San Diego drove his motorbike up to Wyoming to see it firsthand. Upon his return to San Diego he told our group he was not disappointed.
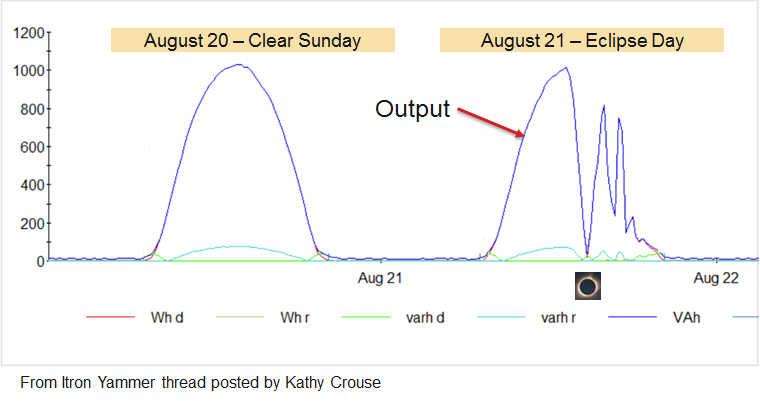
More interesting than the allure of the moon blotting out the sun was later seeing how it affected utility loads. Below is a chart of high frequency data illustrating the impact of the eclipse on the solar panel that is in front of the Itron factory in Oconee. This illustrates how the eclipse lowered solar output (almost to zero) in totality areas. Following the eclipse, afternoon clouds had a similar but less complete impact.
Reflecting this impact, utilities in the path of the totality expected to see an increase in loads as rooftop solar output was reduced. That is, all else equal, as solar production dropped, the utility system would need to make up the difference. However, it was a clear, warm summer day with significant air conditioning loads in most areas, and as we will see, all else was not equal.
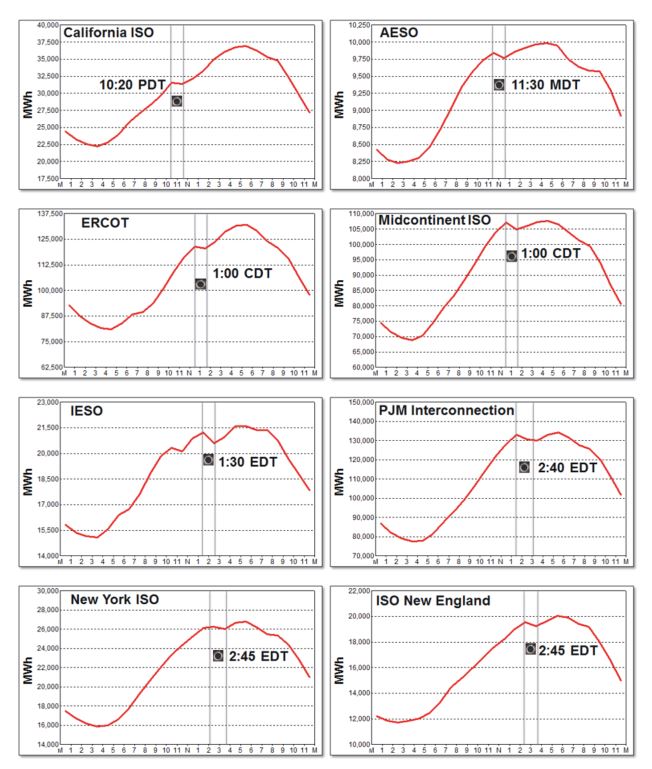
Using publicly available data provided by the North American ISOs/RTOs/TSOs, we can see that loads in fact declined as the path of totality traversed across the continent. Below is a series of charts displaying the hourly loads for each of the ISOs/RTOs/TSOs on Aug. 21 with the time highlighted at which the eclipse reached its fullest in each area.
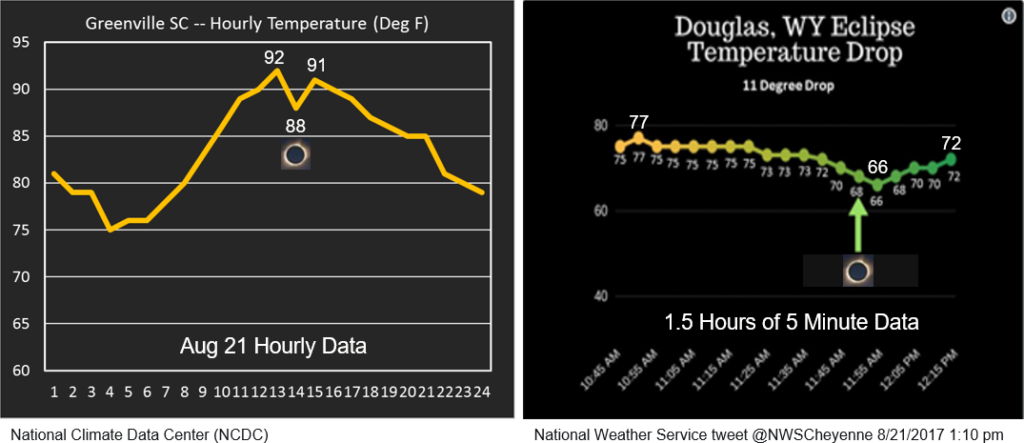
In looking at the data, we see that the loads moderately drop during the eclipse hours. This is attributed to the drop in temperature, which accompanies an eclipse, an outcome that many eclipse viewers observed. Apparently, the temperature drop and the corresponding decline in air conditioning loads outweighed the loss of solar output. Obviously, location played a big role, as some places experienced a steeper drop in temperature than others. Below are two charts demonstrating the decline in temperatures as recorded in Greenville, South Carolina and Douglas, Wyoming, respectively.
Greenville is close to the location of the Itron plant where the measured solar output data was collected. This is hourly data from NOAA and shows a drop of about four degrees. The data for Douglas is five-minute data, and these high frequency data show an eleven degree drop – certainly enough to reduce air conditioning loads.
So, that is how it all worked out on a warm summer day. We might expect a very different result from an eclipse on a cold day in the middle of winter. In this case, the temperature drop would increase heating loads, which would amplify the effect of the drop in solar production and would probably increase utility loads significantly. The next total solar eclipse visible from North America will be on April 8, 2024. Maybe if it is still cool in some parts of the Midwest and New England on that day we can see if this conjecture holds. Stay tuned.
David Simons is a Forecast Consultant with Itron’s Forecasting Division. Since joining Itron in 2013, Simons has assisted in the support and implementation of Itron’s short-term load forecasting solutions for GRTgaz, Hydro Tasmania, IESO, New York ISO, California ISO, Midwest ISO, Potomac Electric Power Company, Old Dominion Electric Cooperative, Bonneville Power Administration and Hydro-Québec. He has also assisted Itron’s Forecasting Division in research and development of forecasting methods and end-use analysis. Prior to joining Itron, Simons conducted empirical research, performed operations analysis and data management for a nonprofit, and lectured in economics at San Diego State University while pursuing his master’s degree. Some of his empirical research includes examining the behavioral factors that influence educational attainment in adolescents and the environmental implications of cross-border integration. Simons received a B.A. in Business Economics from the University of California, Santa Barbara and an M.A. in Economics from San Diego State University.