The issue of aggregation bias should not be a new concept to any of us in the energy forecasting world. In April, my colleague David Simons posted about the potential pitfalls of aggregation bias when calculating weather concepts, pointing out the importance of calculating CDD and HDD concepts prior to averaging.
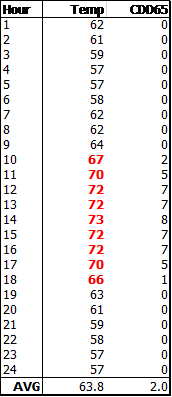
Traditionally, CDD and HDD concepts are constructed by first calculating daily average temperature— either averaging the 24-hourly observations or taking the average of the daily maximum and minimum— and then calculating CDDs and HDDs for the desired breakpoints. This is, by definition, aggregation bias, averaging before calculating the nonlinear values. This got me thinking, should we be calculating CDD and HDD concepts on the hourly values first and then averaging for the day? If you do not have historical hourly weather, the point is moot. But let’s assume you do. The table below contains 24 hourly temperature observations. The average temperature for the day is 63.8 degrees, calculating a CDD in base 65 would result in zero CDDs, but if you first calculated the CDDs and then averaged, you would end up with two CDDs. Was there cooling during the day or not? Thinking from a residential customer’s perspective, a few warm hours in the middle of the day wouldn’t necessitate turning on the air conditioner. During the height of summer or winter, it will not matter—when all hourly observations are above or below the breakpoint, the two methods will return the exact same value.
I set out to test if using hourly constructed CDD and HDD concepts would improve daily or monthly forecasting models. Using historical weather and system load data for a utility in the southeast, I built daily and monthly forecasting models. The daily model was simple—multiple HDD and CDD concepts, lags of weather, binaries for days of the week and holidays, hours of light, as well as a simple trend. I created two identical models, the only difference being how the daily weather concepts were constructed; one with the traditional approach of first averaging the daily temperature and then calculating weather concepts and the other calculated weather concepts from the hourly values, and then averaged. The models were estimated using three years of daily data, with the dependent variable being daily energy. The model with the traditional weather concepts had an Adj. R2 0.957 and a MAPE (Mean Absolute Percent Error) of 2.84 percent. The alternative model had an Adj. R2 0.951 and a MAPE of 3.03 percent. While not drastically different, the traditional weather concepts did provide a better fit and smaller errors. The monthly model was estimated with eight years of data and showed similar results with the traditional weather model having an Adj. R2 0.966 and a MAPE of 2.15 percent, while the alternative model had an Adj. R2 0.961 and a MAPE of 2.30 percent.
Conclusion: It appears there is nothing to be gained from calculating weather concepts from hourly values and then averaging.
Michael Russo is an energy analyst with Itron’s Forecasting Division. Russo is responsible for statistical modeling, data analysis, implementing forecasting software systems and providing client support. Russo has worked with clients to develop forecast models for both short-term and long-term sales, energy and demand forecasts for the electric utility industry as well as the natural gas industry. Russo received his B.A. in Economics from the University of Massachusetts and a M.S. in International Economics from Suffolk University.