A Simple Approach for Addressing Behind-the-Meter Solar Generation
July 11, 2018
Share this story on:
I was recently asked to account for behind-the-meter (BTM) solar generation in a set of day-ahead hourly electric models. Fundamentally, the problem is that electricity consumption (from the perspective of the utility or the ISO) is lower on sunny days, when rooftop solar panels are generating lots of power, thereby reducing the electricity that customers pull from the grid. In many cases, we have little, if any, data on the capacity or generation of these rooftop panels. Further, we may not even have the necessary weather variables.
In this case, I did not have rooftop solar-generation capacity or solar irradiance (i.e., a measure of the solar energy striking a panel). I was not going to let a lack of data stop me!
I did have light intensity, measured in foot-candles. Although not identical to solar irradiance, light intensity is similar enough for our purposes.
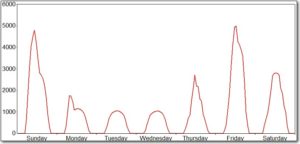
The following figure shows the hourly light intensity for a one week period. The pattern is clear: light intensity increases in the morning hours; it typically reaches a peak during the middle of the day; and it declines in the afternoon. And, the height of the curve varies from day-to-day, partly as a function of cloud-cover.
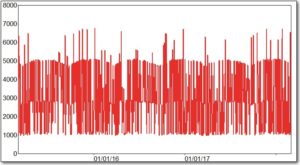
The following figure shows a three-year period of light intensity at noon. My intuition suggests that the spikey values along the top are erroneous and should be excluded from the model. For instance, I doubt that the maximum value is roughly 5,000 in the summer, but occasionally jumps to 7,000.
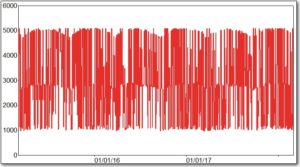
To address these spikes, I built transforms to impose a maximum allowable value for each interval. The resulting series for noon appears below. It’s not perfect, but it does look more realistic. I used visual inspection for each interval to determine the appropriate maximum value.
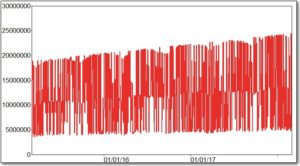
Although I did not have data on solar capacity, my assumption for this area is that BTM capacity is increasing over time. To account for the increasing BTM capacity, I created an interaction variable, which multiplies the light-intensity variables by a linear time-trend variable. The result is a series that moves up and down from day-to-day, as the intensity of the light changes, but which also increases over time, as shown below.
When I drop this variable onto the right-hand side of a regression equation, the variable is highly significant with a negative sign, which is the correct theoretical relationship: more sunshine leads to lower loads.
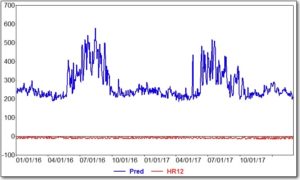
The following is the BX tab from a MetrixND regression model. The figure shows the contribution of the trended solar variable (in red) and the model’s predicted value (in blue). As expected, the contribution to the total predicted value is negative and becomes larger in absolute terms (i.e., more negative), thus reducing the load by larger quantities over time.
While imperfect and admittedly simple, this approach lowers the in-sample MAPE during the middle of the day by roughly 0.3 percent Clearly, the improvement in the statistical models is not dramatic. Still, this technique allows us to incorporate, in a very basic way, an issue that is becoming an increasing concern.
Since joining Itron in 2000, Mr. Simons has developed, implemented and supported numerous day-ahead and real-time forecasting systems for Independent System Operators (ISOs), retailers, distribution companies, cooperatives and wholesale generators, including NYISO, IESO, TVA, Consolidated Edison, NRG Energy, PSEG and Vectren. Mr. Simons has implemented systems to support budget & long-term forecasting, weather-normalization, and unbilled-energy estimation for municipal utilities, electric cooperatives and investor-owned utilities, including Ameren, Entergy and FirstEnergy. Mr. Simons has developed forecasting and analysis solutions for municipal water utilities and has developed several customized applications and models for forecasting revenues, managing bills, weather-normalizing sales and estimating unbilled energy. Mr. Simons has reconfigured, streamlined and deployed load research systems at multiple utilities including United Illuminating, Indianapolis Power & Light, TECO Energy, NVEnergy, Colorado Springs Utilities and Lincoln Electric. Mr. Simons has implemented real-time natural gas forecasting systems to support operations at Vectren Energy and Consolidated Edison. In 2019 and 2020, Mr. Simons was a key team-member on a well-publicized report for NYISO to analyze long-term weather trends across the New York state.